

Together NI LabVIEW & myDAQ have infinite possibilities.
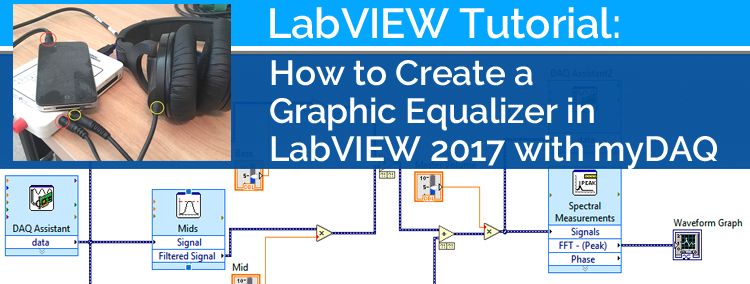
In this post, I’ll provide a step-by-step series of instructions on how to create a graphic equalizer in LabVIEW 2017. A graphic equalizer (EQ) is, in less scientific terms, a device that takes in audio input and can alter specific frequency intensities of a sound wave and output the altered wave. It is one of the most widely used forms of audio processing in both digital and analog sound production. Some graphic EQs have a small number of “bands” and others have many bands. We will be making a 3-band graphic equalizer. A “band” refers to the spectrum of frequencies that are altered by a specific controller. For instance, our 3-band EQ will have 3 sliders that will control the intensity of the low, mid, and high frequencies separately. The low frequency “band” might affect 30 – 200 Hz, for instance.
Getting Started: Creating EQ with LabVIEW
To complete this project, you will need to have LabVIEW installed and an NI myDAQ for data acquisition. You’ll need to make sure you have the DAQmx drivers installed. By the end of the project, we’ll be able to plug a 3.5 mm cable from an audio device (such as your phone) into the myDAQ and process the audio. We’ll then be able to output the audio to a listening device, such as headphones.
Prepare by Watching the Video Tutorial
Before you jump into the project, I recommend that you take a few minutes to watch this tutorial. It will help the project come together more easily for you. Keep in mind, that I made this tutorial video a few years ago with an older version of LabVIEW, but the overall process is still the same. Or if you prefer, follow along with the video as you go.
Setting Up Your Project
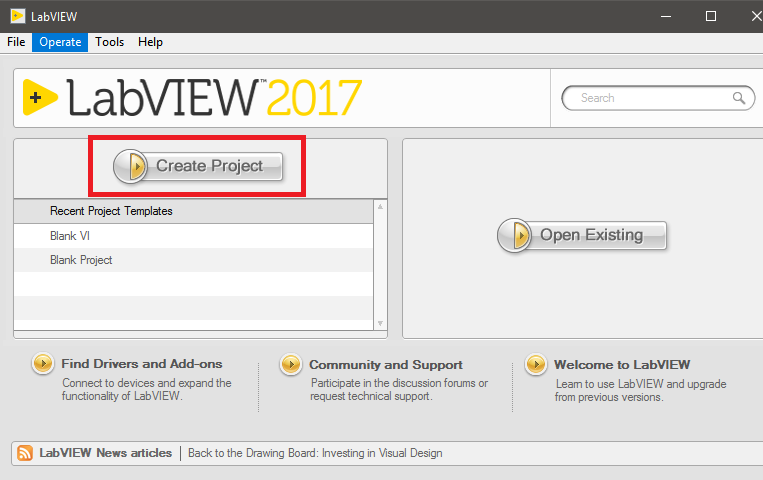
- Open LabVIEW 2017
- Click “Create Project”
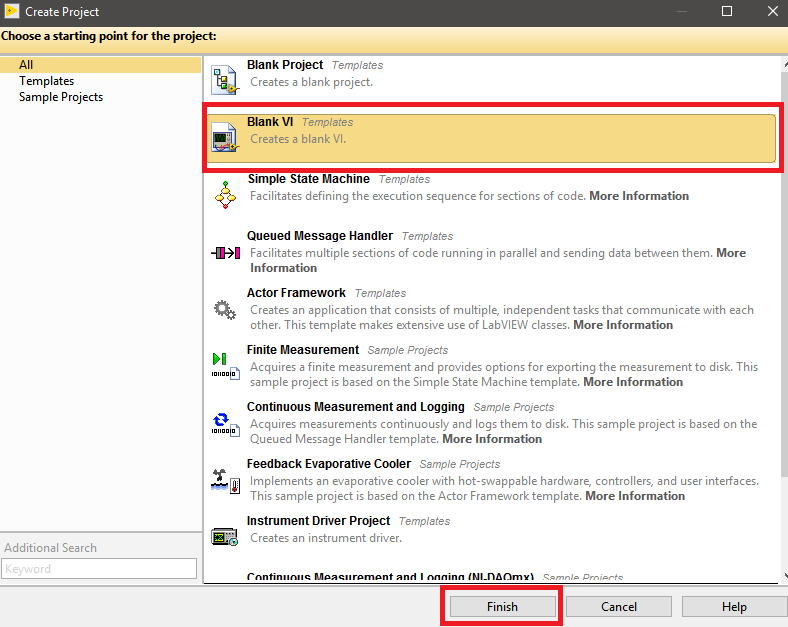
- Choose “Blank VI” on the next window and click “Finish”. This will open a new, empty VI.
Creating the UI
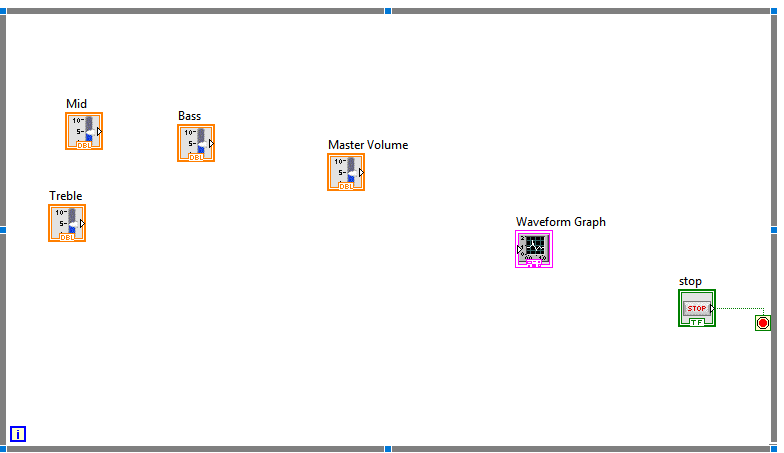
Our UI is going to have 5 elements. There will be a Master volume control and a bass, mid, and treble control. Additionally, we will have a graph that will show us the frequency response of our processed waveform.
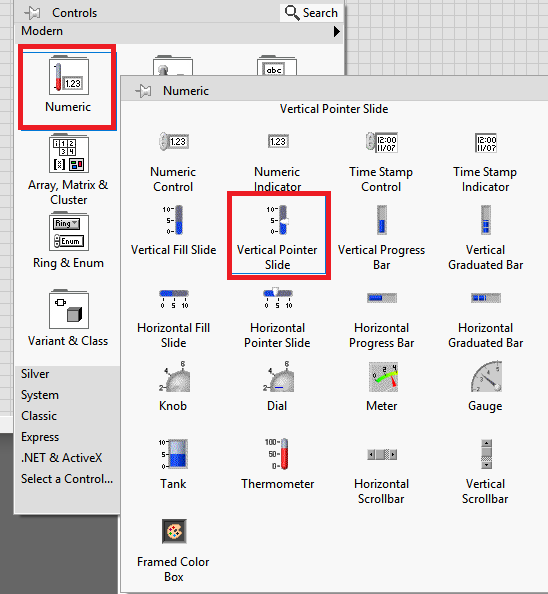
- Make sure you have the front panel window open and right-click anywhere inside of the window. Choose the “Numeric” category and then choose “Vertical Pointer Slide”. Left click anywhere in the window to place the control.
- Right-click on the slider and choose “Properties”
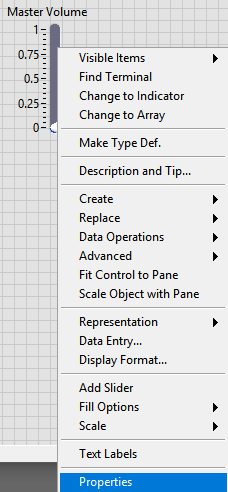
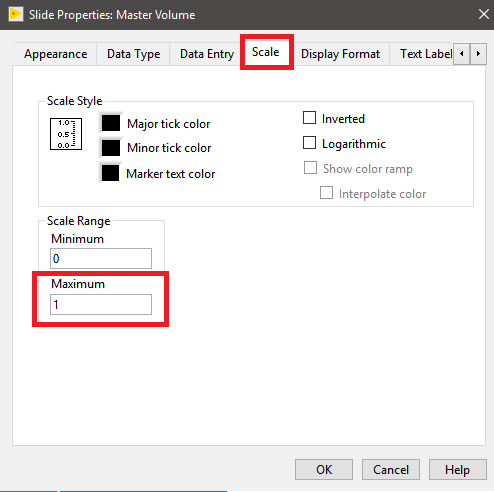
- In the Properties window, click the “Scale” tab, and change the Maximum value from 10 to 1. We will only be using a scale of floating numbers between 0 and 1. Click “OK”.
- Left-click and drag a selection window around the slider. Once it’s selected, press CTRL + C to copy it. Left click somewhere else in the window and press CTRL + V to paste it. Do this 3 times. You should have a total of 4 sliders once you’ve done this.
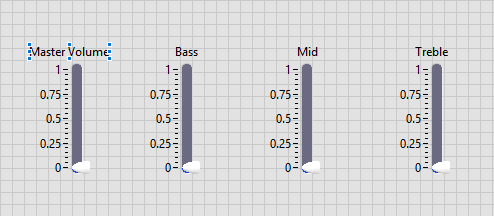
- Position the sliders however you want on your panel. Double-click the text boxes above the sliders and change their names to “Master Volume”, “Bass”, “Mid”, and “Treble”, respectively.
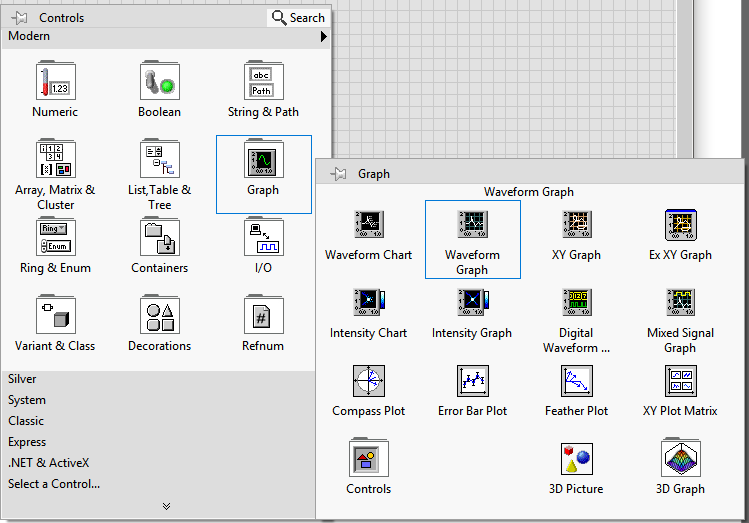
- Right-click an empty spot on the panel and choose “Graph” then choose “Waveform Graph”. Left-click an empty spot on the panel to place the graph.
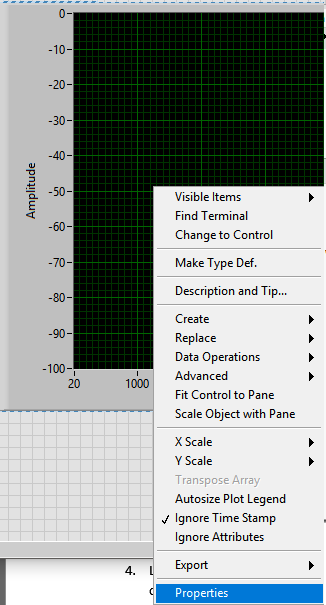
- Right-click anywhere on the graph and choose “Properties”.
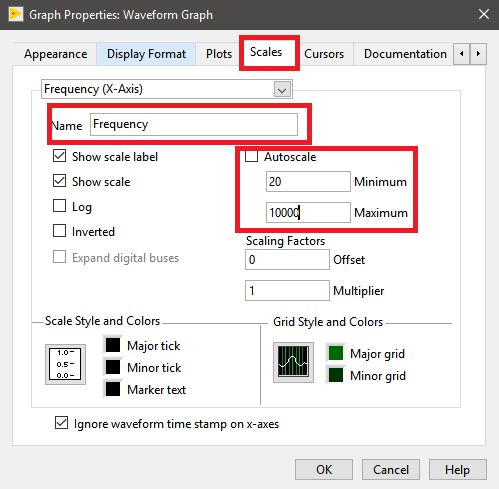
- Go to the “Scale” tab and make sure the “Time (X-Axis)” option is selected. Change the “Name” field to “Frequency” and uncheck the “Autoscale” check box. In the minimum box, put 20, and put 10000 in the Maximum box. This will change how our graph looks. It will show a minimum value of 20 and a maximum value of 10000 on the X-Axis. We will only be looking at up to 10000 Hz.
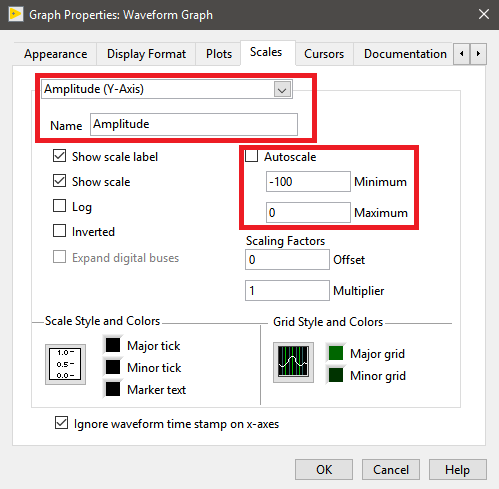
- Click the “Frequency (X-Axis)” drop-down and choose the “Amplitude (Y-Axis)” option. On the amplitude window, uncheck “Autoscale” and set the minimum to -100 and Maximum to 0. In digital audio, negative values are often used for decibel levels. Why this is the case is a question better saved for Google. Once you’ve set both the X and Y axis’ up, click “OK”.
We now have our basic UI setup. You can tweak the dimensions of your sliders or graph if you want.
The Block Diagram
A UI isn’t very useful without some functionality for our UI elements to execute. To give functionality to our UI elements, we will use the block diagram in LabVIEW.
- Open the block diagram by pressing CTRL + E or click “Window”→ “Show Block Diagram”. You should see your 5 UI elements on the block diagram.
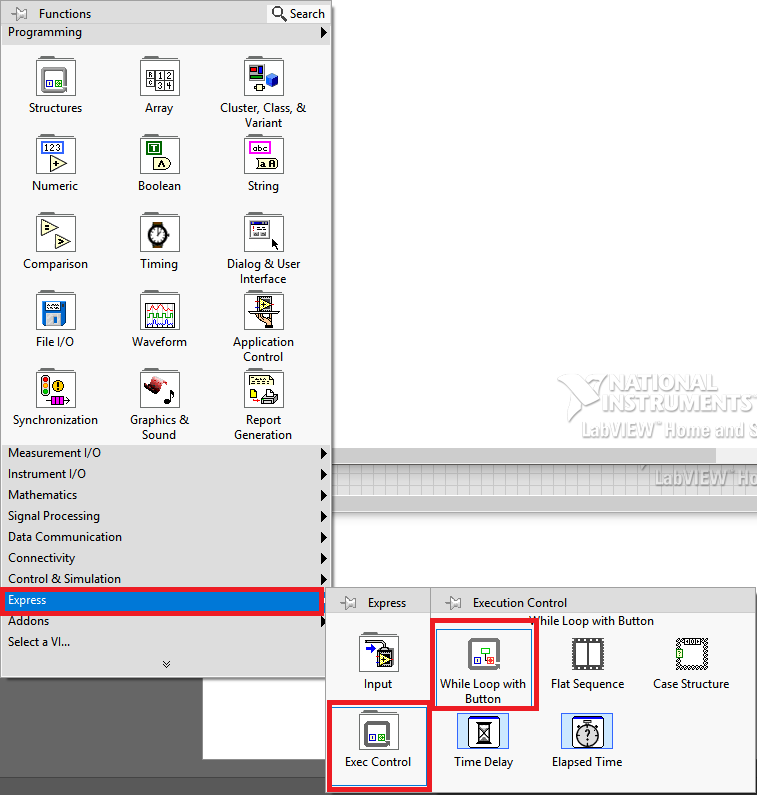
- Right-click anywhere in the empty white space and choose “Express” and then choose “Exec Control” then choose “While Loop with Button”. Left-click and drag in the window to place the while loop. Once you let go of the left-click, the loop will be placed.
- Make a selection box around your 5 UI blocks and drag them all into the interior of the loop. The loop will be used to run our program continuously.
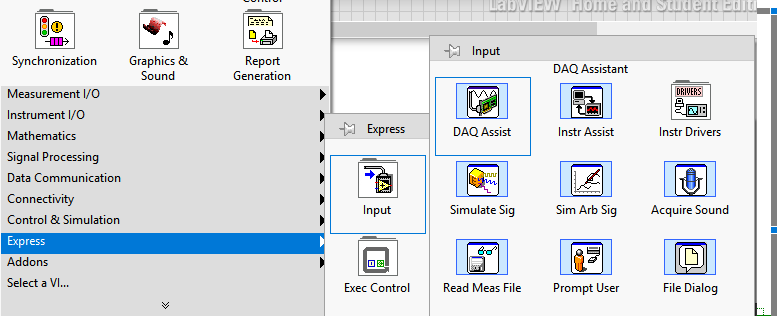
- First, we need to be able to acquire data from the myDAQ. To do this, right-click inside the loop, in an empty space, and choose “Express” → “Input” → “DAQ Assist”. Place the DAQ assist block near the left-side of the loop.
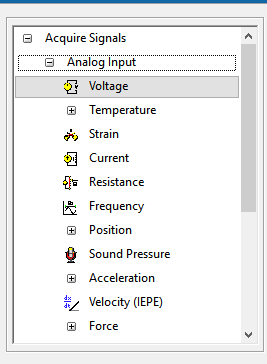
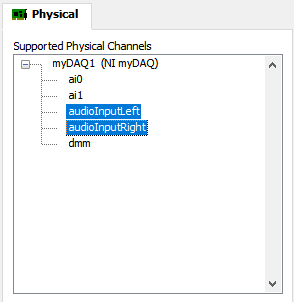
- When the DAQ Assist window opens, choose “Acquire Signal”→ “Analog Input”→ “Voltage”. On the next window that opens, hold CTRL and left click “audioInputLeft” and “audioInputRight” then click “Finish”.
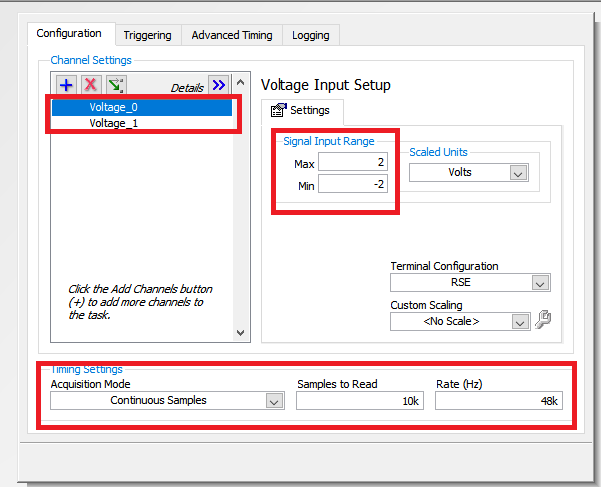
- On the next window that comes up, there are several things you need to do. Left-click on “Voltage_0” and set Signal Input Range Max to 2, and Min to -2. Do this for “Voltage_1” too. Then, under “Timing Settings”, choose “Continuous Samples” from the “Acquisition Mode” drop down. Set “Samples to Read” to 10k and set “Rate (Hz)” to 48k. Click “OK”. This allows the myDAQ to continuously get data from our audio device. It will set the Rate to 48k, which is one of the industry standards for digital audio.
Creating Filters
We need to create three different filter blocks. The filters will allow us to take our signal and isolate specific frequency ranges from it. This will allow us to manipulate those specific frequencies however we want.
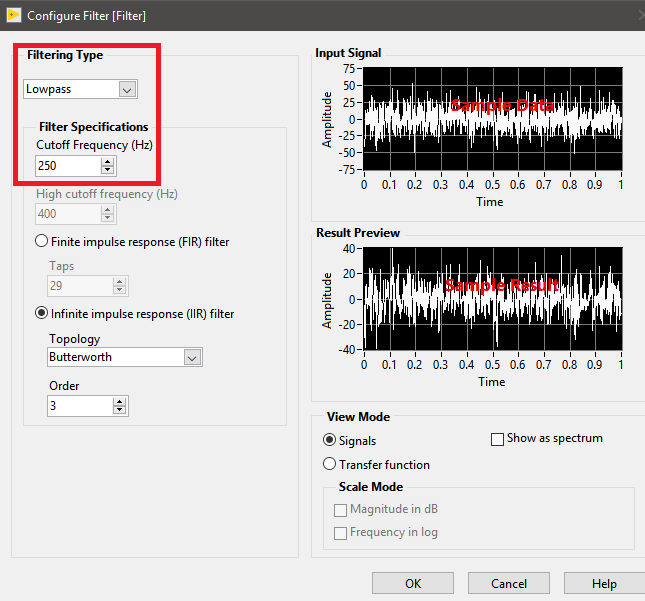
- Right-click an empty white space inside the loop and choose Express → Signal analysis → Place the Filter block inside the loop. A window will come up. Our first filter will grab bass frequencies. Make sure “Lowpass” is selected in the “Filtering Type” drop-down. Set the “Cutoff Frequency” to 250. Click “OK”.
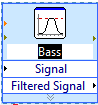
- Once the filter is placed, I recommend double-clicking the “Filter” text on the Filter block and changing the name to “Bass”. This will make it easier to keep track of your filters.
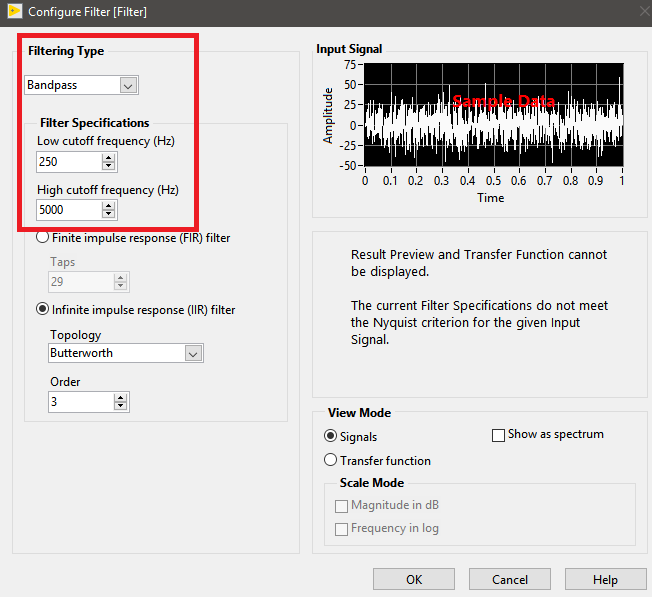
- Create another filter using the same process. However, for the configuration settings, choose “Bandpass” from the “Filtering Type” drop down. “Low cutoff Frequency” should be set to 250 and “High cutoff Frequency” should be 5000. This means that our band will grab all frequencies between 250 and 5000. Click “OK”.
- Rename this block to “Mids”.
- Create a third filter. In the filter settings, set the “Filtering Type” to “Highpass”. For the “cutoff frequency”, set it to 5000. This filter will grab all frequencies at 5000 Hz and above. Click “OK”.
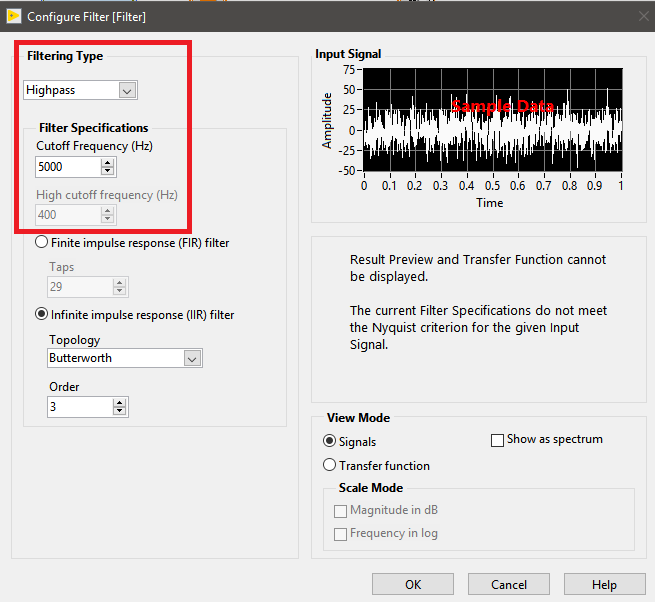
- Rename this block to “Treble”.
Sending Data to the Filters
We need to send the audio data from our myDAQ to our filters.
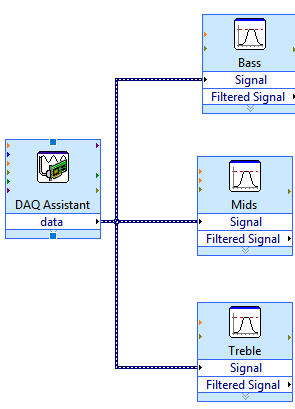
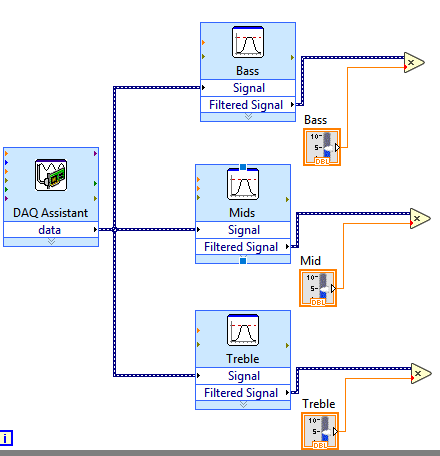
- Create three wires from the DAQ Assist “Data” node to the “Signal” nodes of each filter, as seen here:
Manipulating the Frequencies
Now that our signal is being split into three frequency ranges, we want to be able to manipulate each frequency spectrum using our sliders. To accomplish this goal, we will simply use multiplication. Our sliders will work in a range of 0 – 1. We will use this sliding value and multiply it against the frequency spectrum’s data. By doing this, our sliders will, essentially, act as a volume control for a specific frequency spectrum. For instance, if we multiply our Bass spectrum (0 – 250 Hz in our case) by 0.6, then all of the frequencies between 0 and 250 Hz will have their amplitude lowered to 60% of their max value.
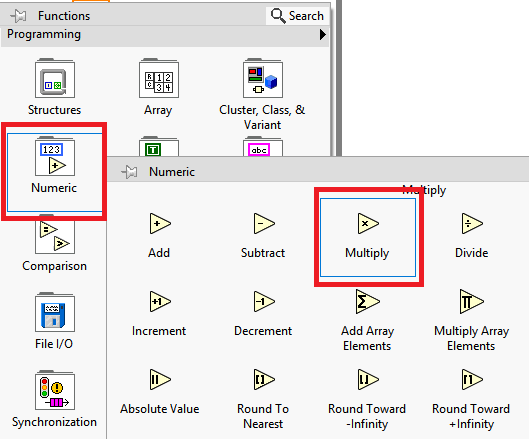
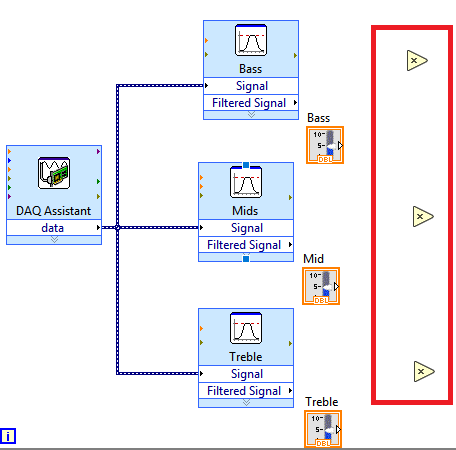
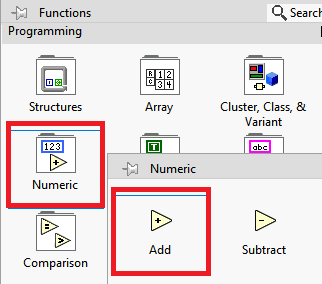
- Right-click inside the loop in an empty space and choose “Numeric” → “Multiply”
- Place the “multiply” block into an empty white space inside the loop. Copy this block and paste it two more times so you have a total of 3 multiplication blocks.
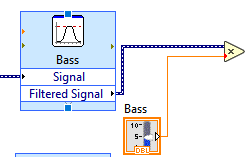
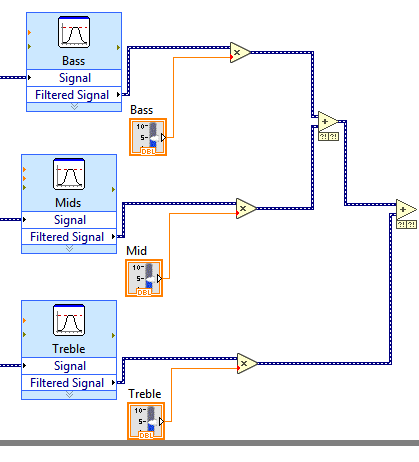
- Now, we need to wire the filtered signal from a filter into one of the multiplication inputs. Then, we need to wire the associated slider to the second multiplication input. For example, the Bass filtered signal should connect to the top input of the top Multiply block. The output from the “Bass” slider block should be wired into the bottom input of the top multiply block, like so:
- Do this for the Mids and Treble blocks. You should end up with a diagram like this:
- Now, we need to add the new values together to create a processed signal that incorporates all the frequency spectrum. Right-click an empty white space inside the loop and choose Numeric → Add
- Place two “Add” blocks into the loop.
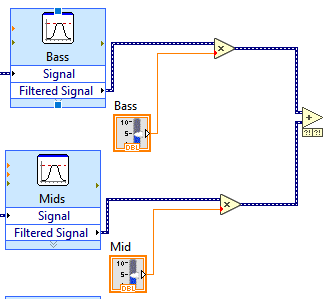
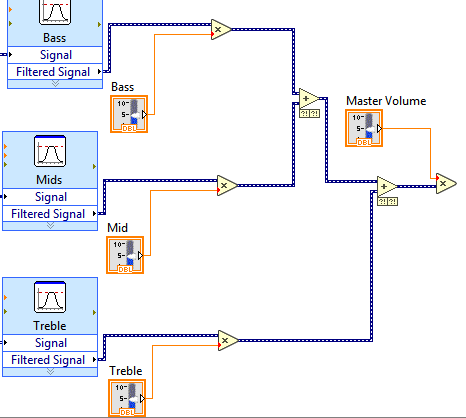
- Now, we need to wire the multiplied results of the Bass and Mids into the inputs for the first addition block, like so:
- Now, we need to wire the Treble multiplication result and the sum of the bass and mids together, like so:
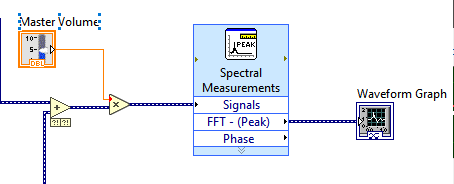
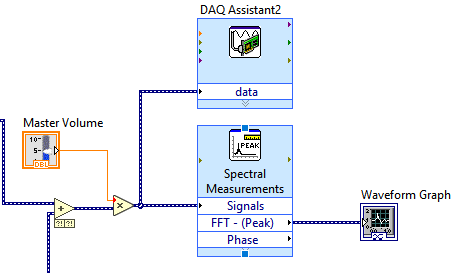
- We need to wire the Master Volume slider now. To do this, we’ll add a Multiply Block to the loop. We will need to wire the total sum of all three signals to the first multiply input. Then, we will wire the Master Volume slider to the second multiply input, like so:
Graphing the Frequency Response
We want to graph the frequency response of our processed audio. To do this, we will perform a spectral analysis on the data and output the analysis to the graph.
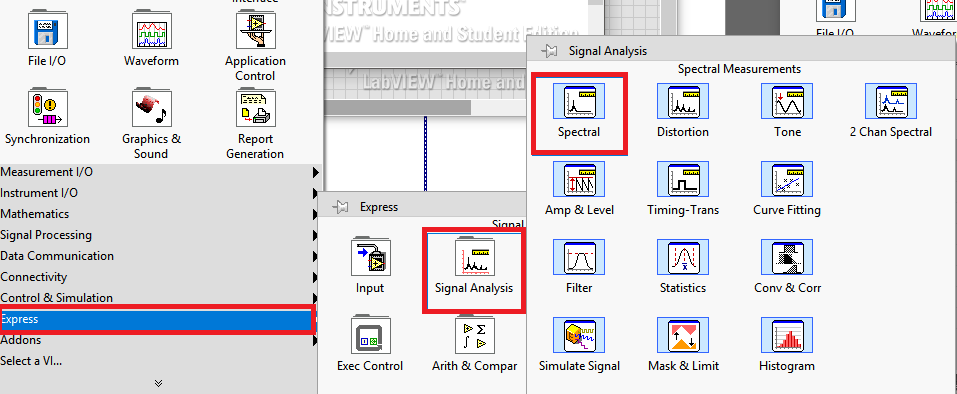
- Right-click inside the loop and choose Express -> Signal Analysis -> Place the block inside the loop.
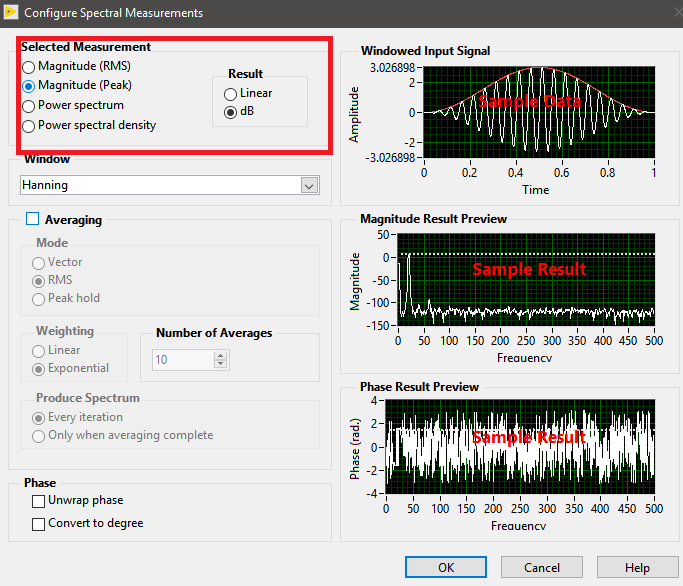
- In the window that comes up, choose “Magnitude (Peak)” and make sure it’s set to dB. Click OK. You can try different measurement options. Peak magnitude will show us the peak amplitude of the frequencies.
- Now, we need to wire our multiplied master signal to our Spectral Analysis input. Once that’s done, we need to wire the FFT – (Peak) output to the Waveform Graph input, like so:
Outputting the Processed Audio
We now need to send our signal to the line out on our myDAQ so we can hear the result. This only requires us to create another DAQ Assist box and set it to output.
- Right-click inside the loop and choose Express → Input → DAQ Assist
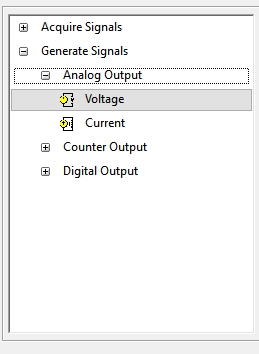
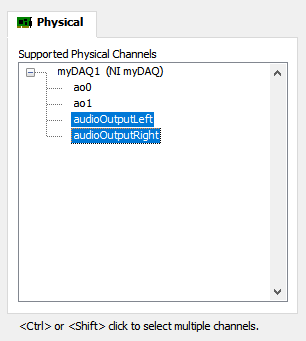
- On the window that comes up, choose Generate Signals → Analog Output → On the next window, hold CTRL and left click audioOutputLeft and audioOutputRight. Click “Finish”.
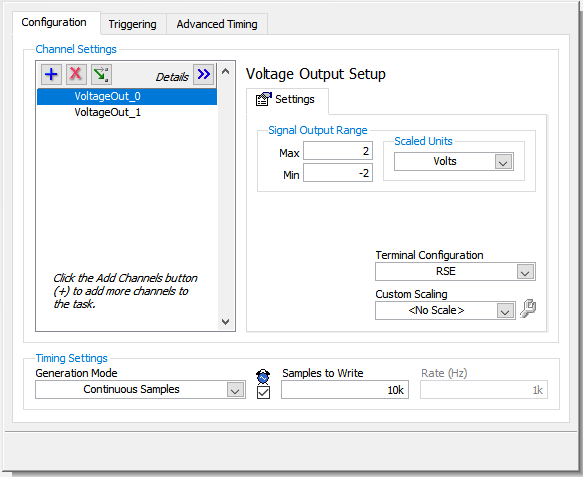
- In the channel settings window, we will setup our output to be the same as our input. Set both Voltages to 2 and -2 and change “Generation Mode” to “Continuous Samples”. Set “Samples to Write” to 10k.
- Lastly, we need to wire the multiplied Master Volume output into the DAQ Assist input, like so:
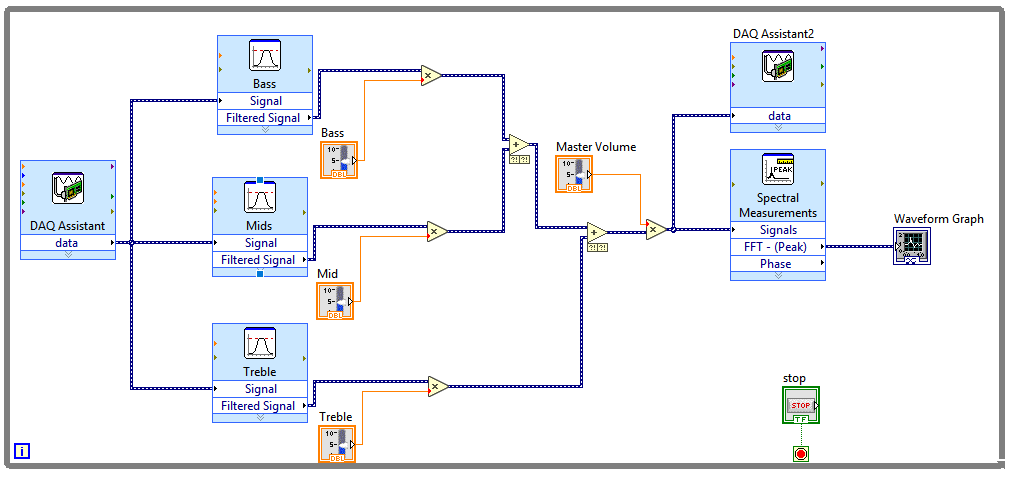
This is all you need for the block diagram. Here’s a screenshot of the complete diagram:
Listening to the Result
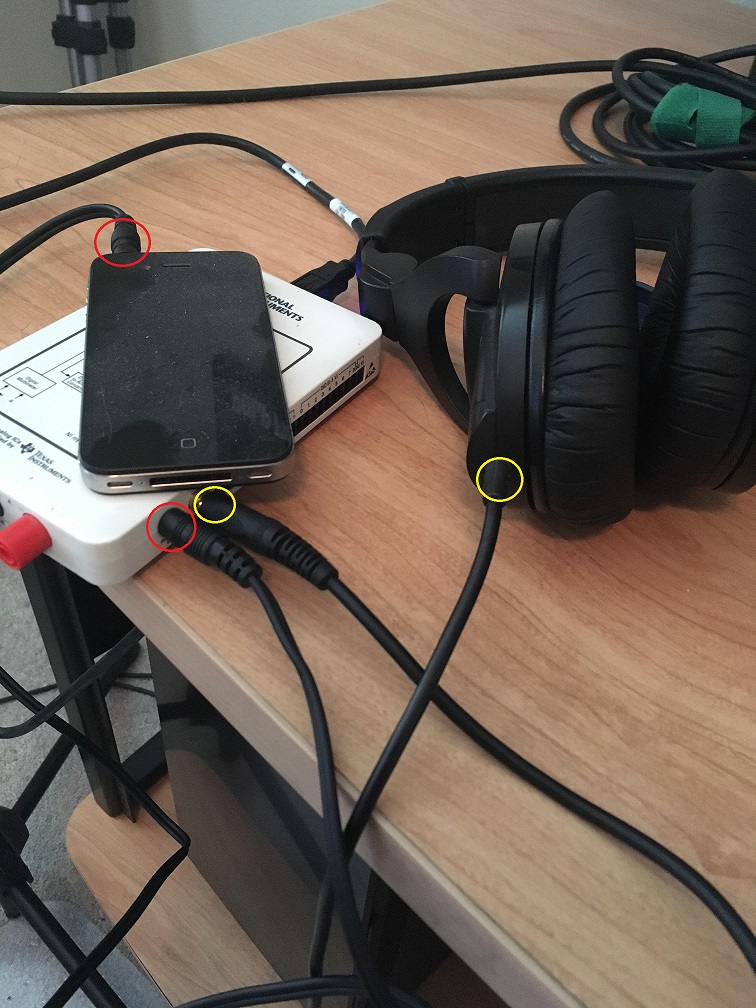
At this point, everything is done. All you need to do is plug an audio device and listening device into the myDAQ and run the program. I am using an iPhone with a 3.5 mm cable connected from the iPhone headphone jack and plugged into the myDAQ Audio in. I have my headphones plugged into the myDAQ Audio Out.
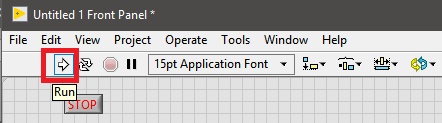
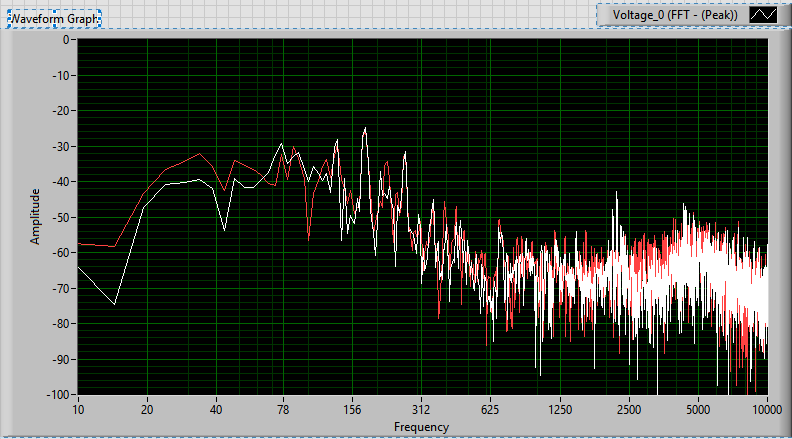
Now, if you run the program, you should be able to manipulate the controls on the front panel and hear the changes happen. You should also see the graph reflecting the frequency response of your processed signal. If you drop the treble to 0, for instance, you should see everything about the 5k frequency area start to drop off on the graph.
The “Run” button is near the top-left of the window, underneath the “Edit” button on the front panel.
Further Customization
If you want a better-looking graph (in my opinion), you can change the graph scale properties to “Log”. To do this, right-click on the Graph and choose “Properties” → Scale tab → Check the “Log” box.
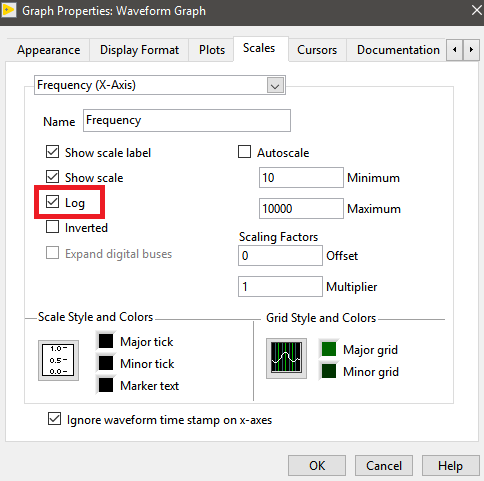
This will give us a more even look at the whole frequency spectrum since our bass spectrum is significantly smaller than our mid or treble spectrum. The logarithmic graph will allow the bass spectrum to show up more prominently on the graph.
Additionally, you can add your own markers to the frequency axis by right-clicking the graph → X Scale → Marker Spacing → Arbitrary
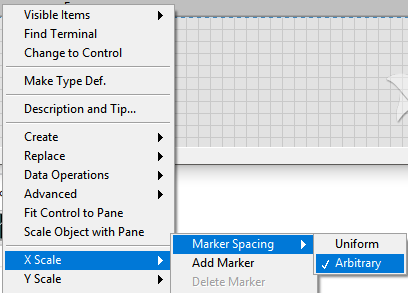
Once you’ve done that, you can go to the X Scale menu again and choose “Add Marker”. You can give each marker a value by double-clicking the number on the marker and putting in the number you want. I set mine up to show half the value of the number higher than it, like so:
You can also add bands if you want to. All you would have to do is add more slider controls and wire them appropriately. The block diagram would probably get rather convoluted as you add more bands, however. Try making a 6-band EQ and see how it goes!
Conclusion
You now have a working graphic equalizer in LabVIEW! Hopefully, this gave you a decent introduction to audio processing in LabVIEW. There is much more you can do with LabVIEW and the myDAQ. NI (formerly National Instruments) offers a variety of solutions for education.
Share this Post